Why Our Data?
Organizations and companies must have clear accurate market, economic, retail, and demographic data at the micro level on China.
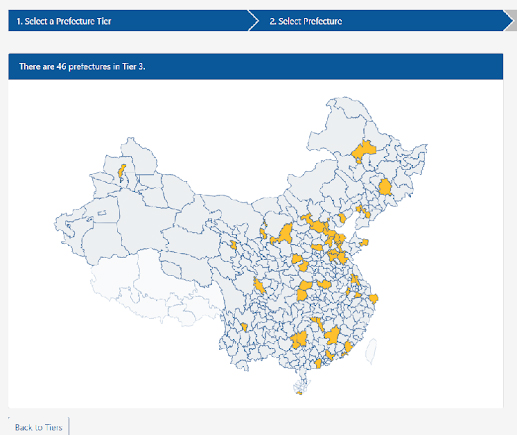
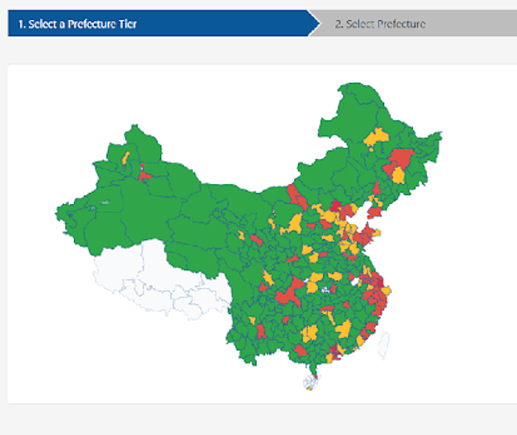
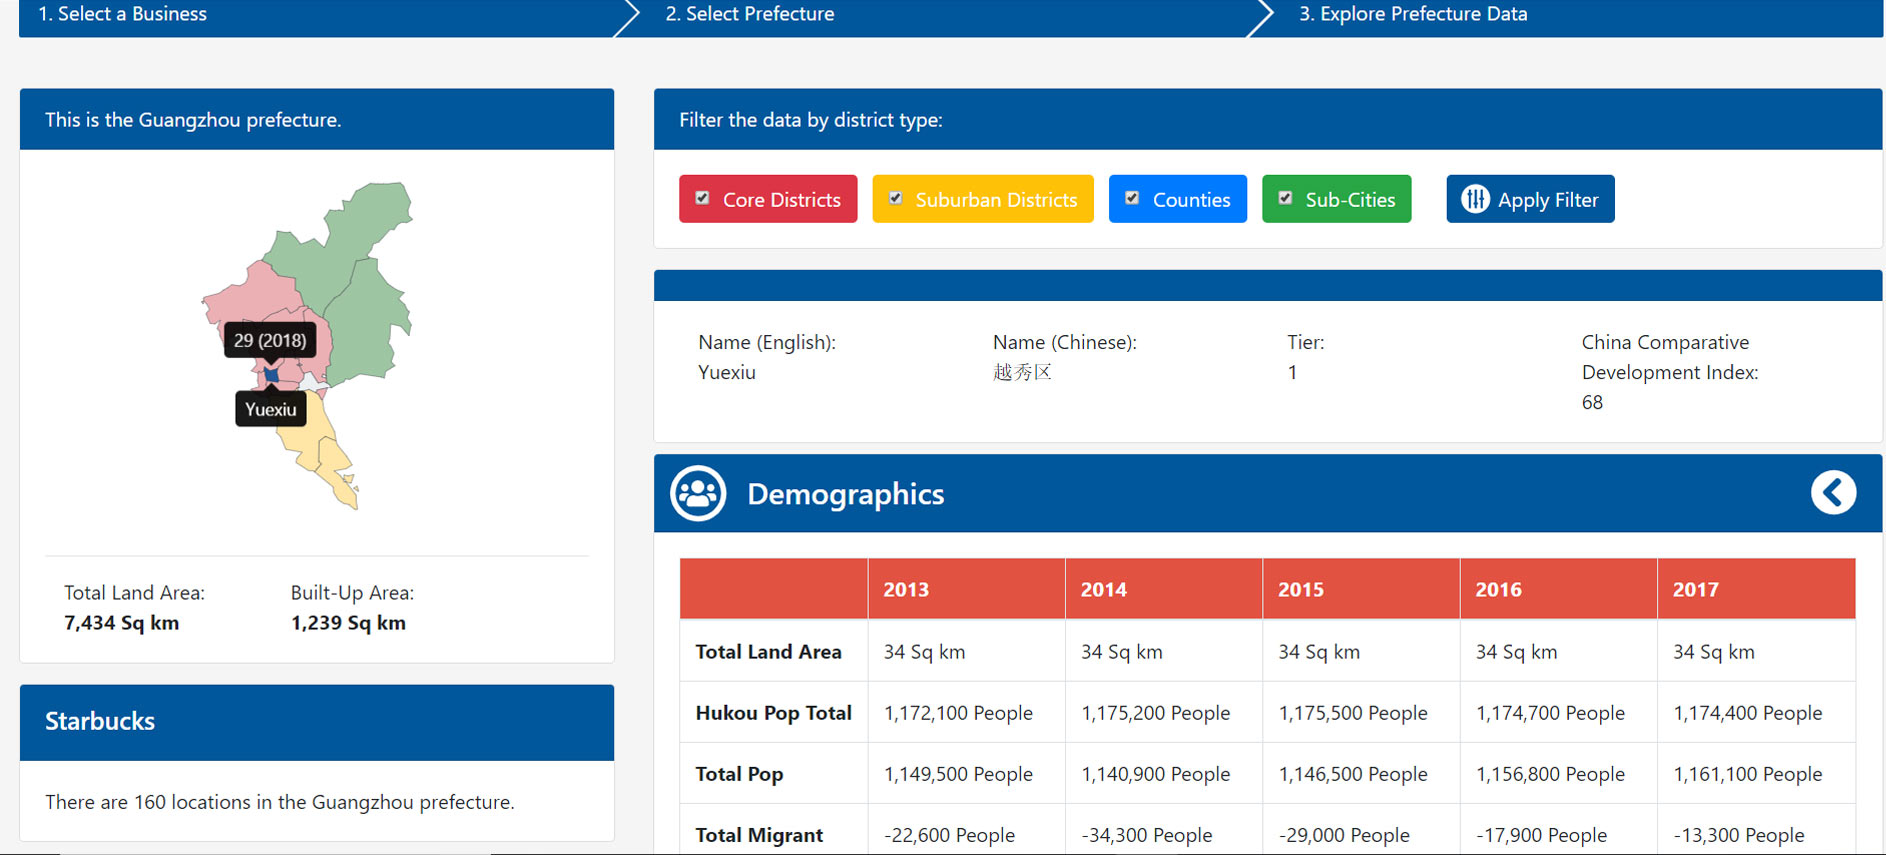
eChinaMetrics data tool provides organizations and companies precise market, retail, and consumer data across all parts of China at the micro-level through its own proprietarty data banks built all over the past 15 years.
Business Intelligence
- Who and where are the Hakkanese?
- What cities, counties, districts are the best-emerging areas to consider?
- Where are females aged 15-34 in the fasted-growing areas with the highest retail growth rate?
- We aggregate our data allowing for robust propensity modeling.
- We use multiple China and indexed each of its parts so one can easily pinpoint “look-a-like markets to expand into.
Economic Indicators Tool
- We provide core insights for the C-Suite who can get to what they want in a couple clicks.
- Find out where the key brands are located and more importantly why they have chosen where they are.
- Easily find markets that are at the same level of development via our comparable market features.
- The tool allows for data and analytics people to take a deep dive into the data they need to do modeling and projections.
- Just one click engages the heat map of where the item selected is most vibrant.
Where Are Leading Retail Brands
Why Have Brands Expanded Where: We have taken China’s top foreign brands (in terms of consumer affiliation) and mapped where they are and how they have grown over the past 10 years.
A simple comparison, Starbucks has so much more room for growth…. Especially in-light of what KFC has done.
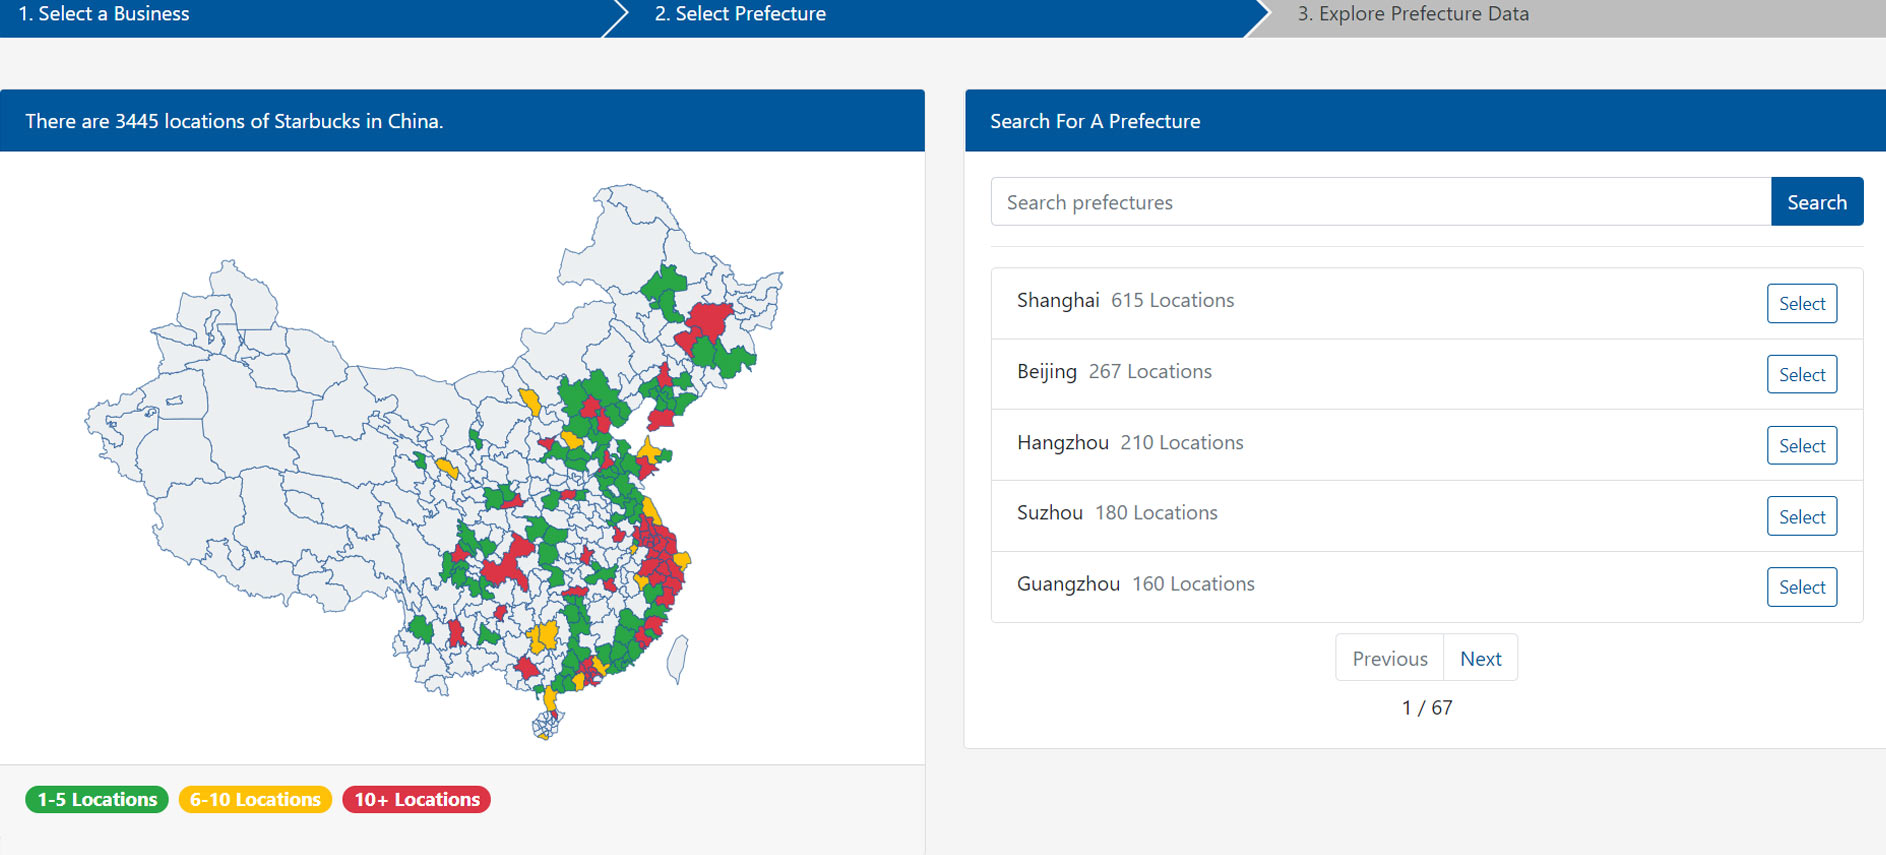
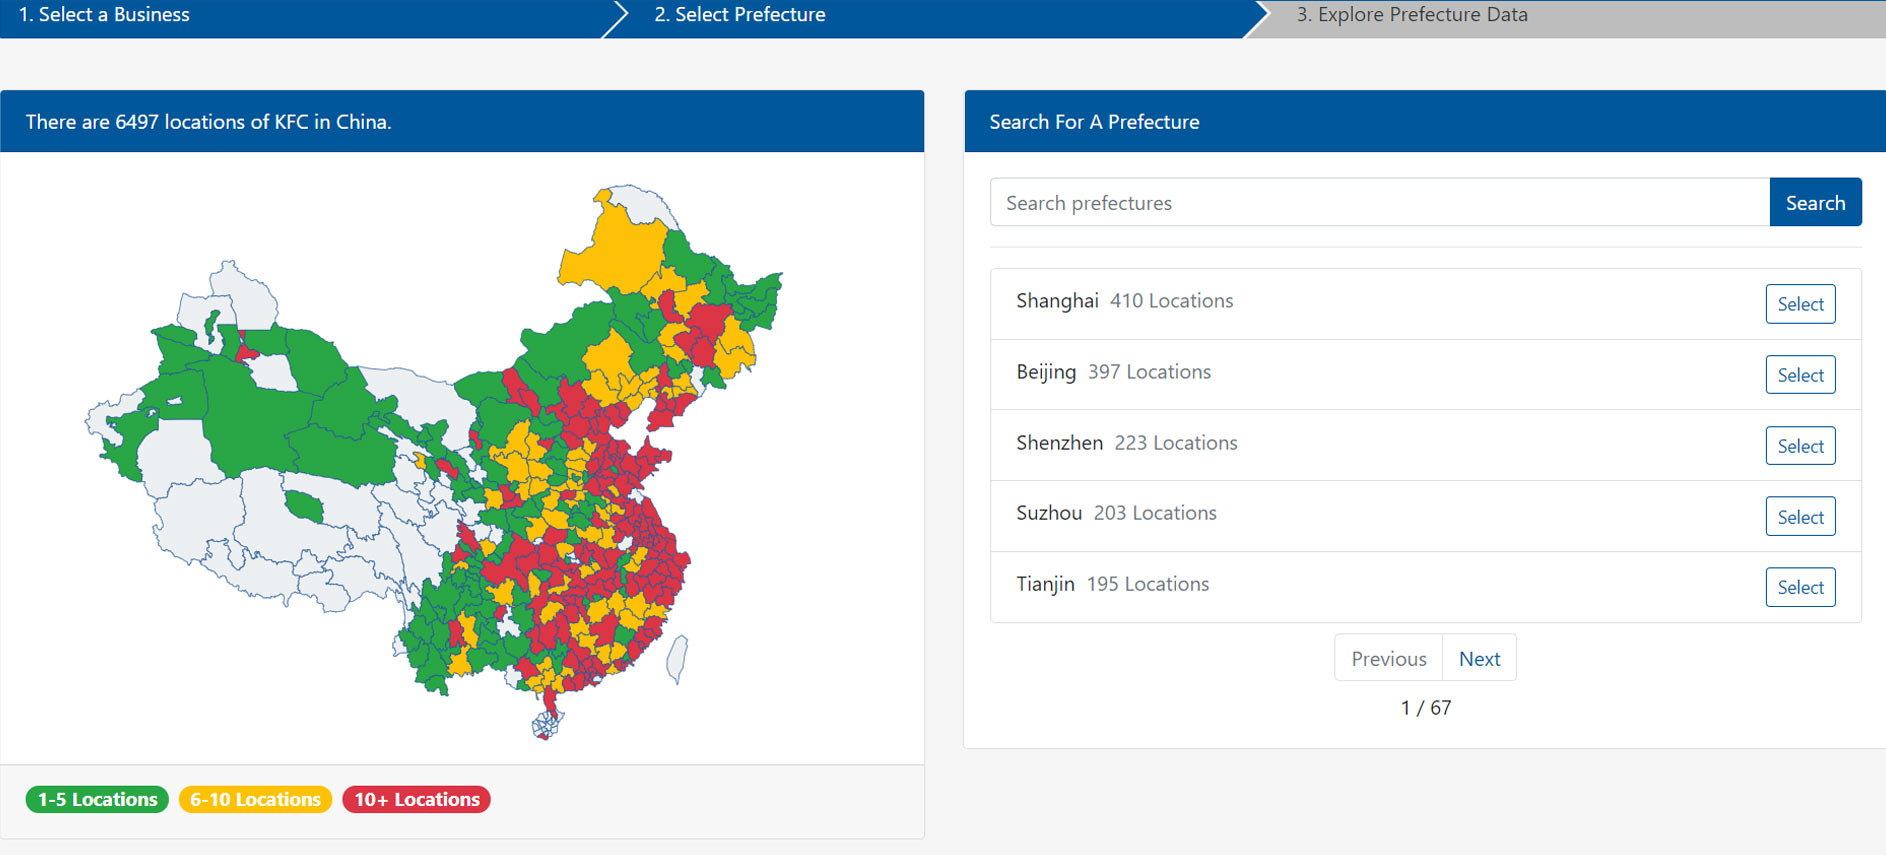
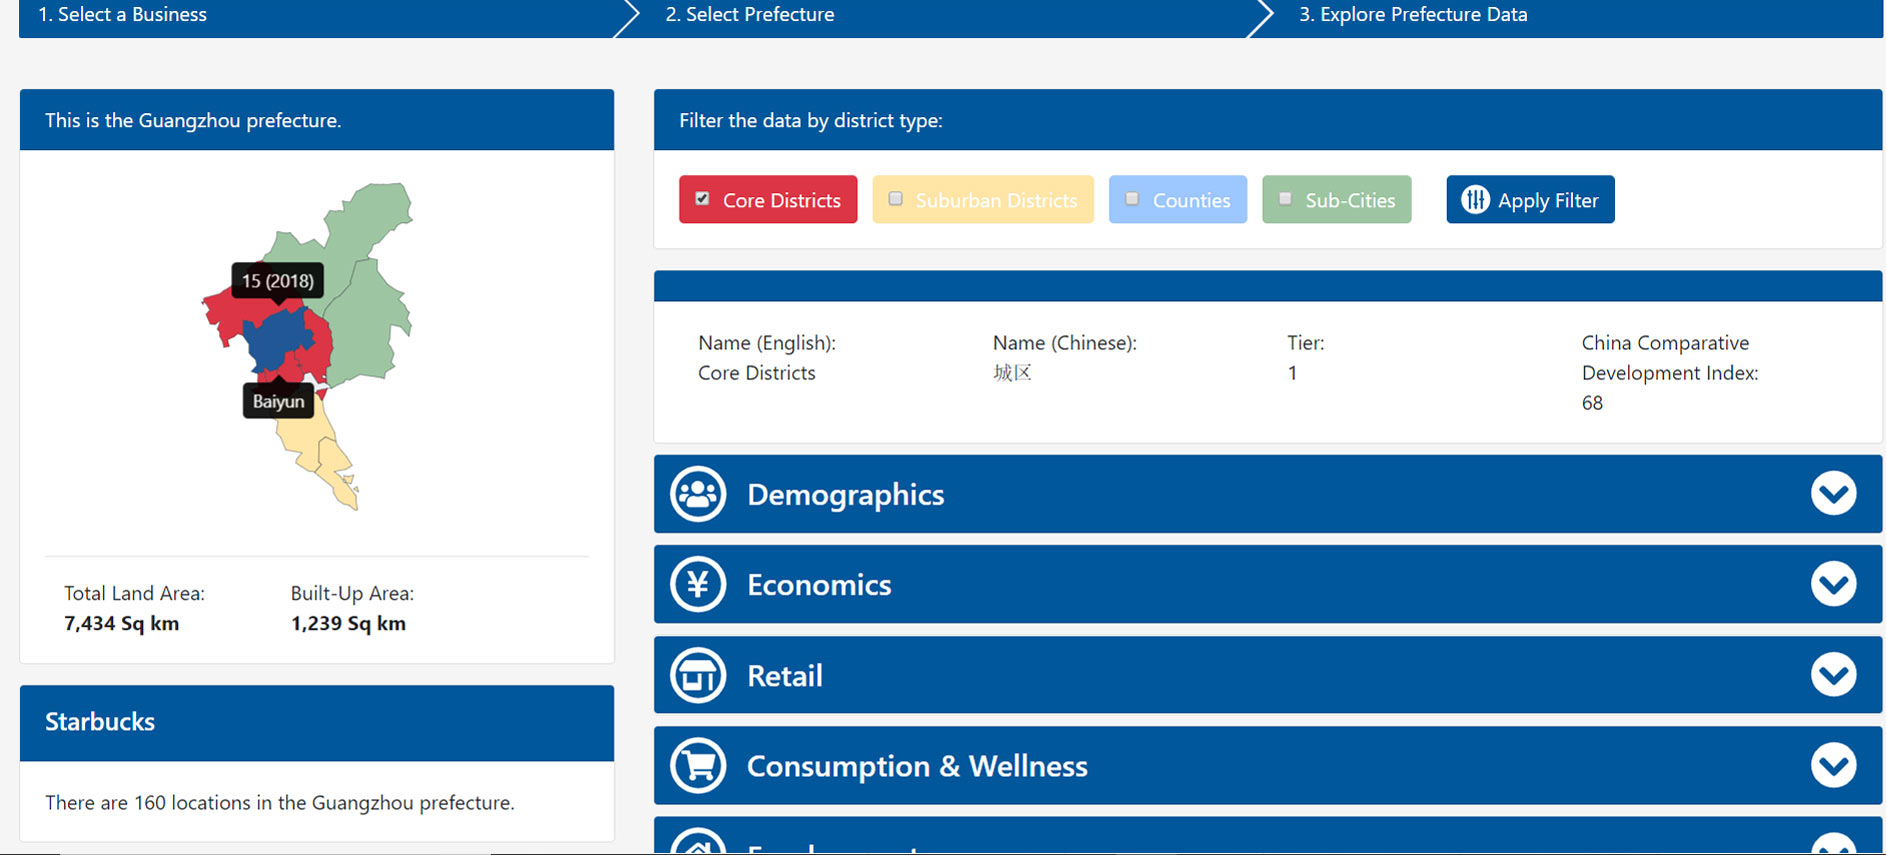
Where Are They In Each Prefecture
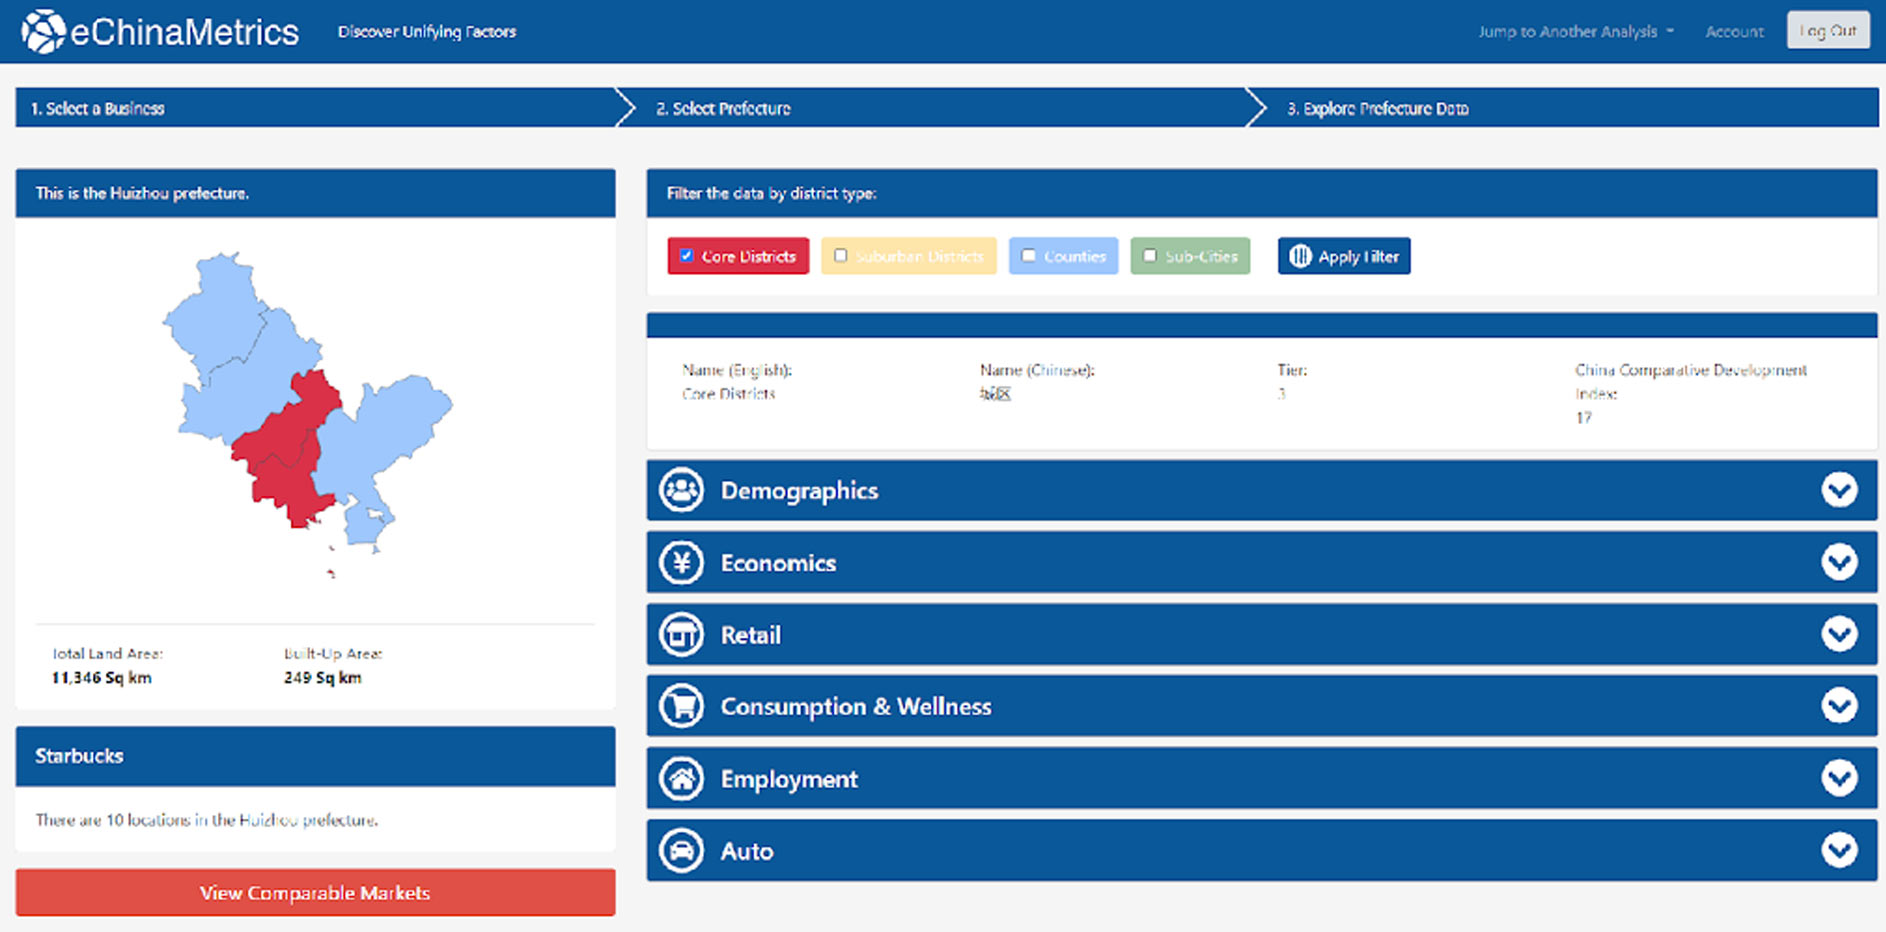
It’s not only important where the China-favored brands are in each city, but also what exact parts of the city they are located.
This is imperative to know what are the most vibrant sub-parts of each city.
Why Are They Going To Certain Places, Districts, Cities, and Counties
For a competitor to a major coffee brand, we were able to determine where that brand was opening new outlets and why.
Based on where the major coffee brand was, they were in almost every place that had X amount of total per capita retail sale, populace in those areas with or over X percent college education, and where outside people were more rapidly moving into.
However, there were a few areas that did not meet the above criteria, but that major brand had a strong presence in. After running data, we discovered those additional places were opened because of the amount of Foreign Direct Investment that went there over a five-year period, and the total number of foreign vistitors traveling to those destinations.

What Is Your Addressable Market
Where are your potential consumers, how many are there, & where are they located: The Chinese market is vast with multitudes of opportunities. It is a place where even a niche brand can have a market of 50+ million consumers.

Featured Cases:
- A chocolate brand: what is our market size?
- A computer brand: where do we go to for business growth?
- An infant formula company on what products to bring to what cities & market segments.
Combining market research with CRR data: For the chocolate brand and infant formula brand, primary market research was conducted to profile what their consumers look like.
Using the eChinametrics/CRR look-a-like tools
For the computer brand, the client shared with us their sales data in different parts of China.
After profiling who the customer was/would be for their products, we determined what are the demographic and economic triggers of who the buyers were. Using the CRR ‘look-a-like’ consumer segmentation, it was determined that the addressable market for this brand was 125 million consumers.
Market research was conducted across a representative sample in different development tiers in different regions in China. We were able to determine what percent of new mothers were breastfeeding immediately and what age/stage they started using infant formulas.
- Among moms with kids under 3 years old, we determine what brand/product types they were using and when they switched from one type of product to another.
- With the CRR data, and demographic profiling we knew how many kids were being born each year, their ages from 0-3, and determined what the potential market size would be for each of the company’s product alternatives.
We looked at what were the unifying factors were in the markets in which the client’s products were doing better in.
We then profiled those markets and looked at what “look-a-like” markets they were quite similar too.
We then provided the client with a detailed report on what additional 20 markets throughout China would provide them the best opporunities for growth, sales, and market expansion. They thus had a 2-year market plan on growing their business.
