Sample Data
Understand critical aspects of the China market. You can freely explore our platform’s data, and complete your own in-depth data analysis to make factual data-based decisions.
Find Comparable Markets
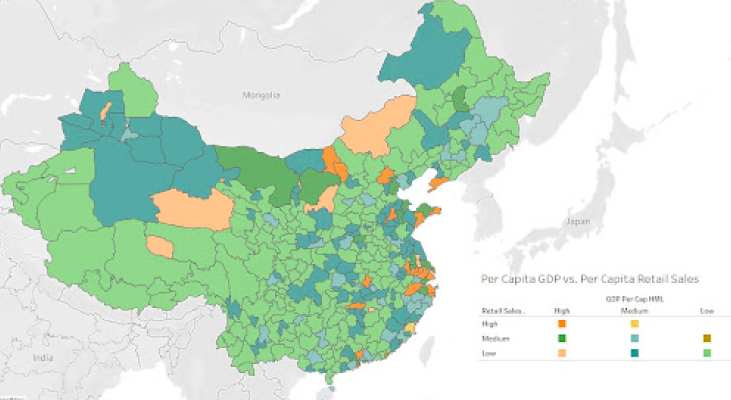
One of the benefits of using Business Intelligence (BI) Tools is the ability to crosstab data and then visualize it. In this case we are comparing GDP per Capita versus Retail Sales per Capita across all of China.
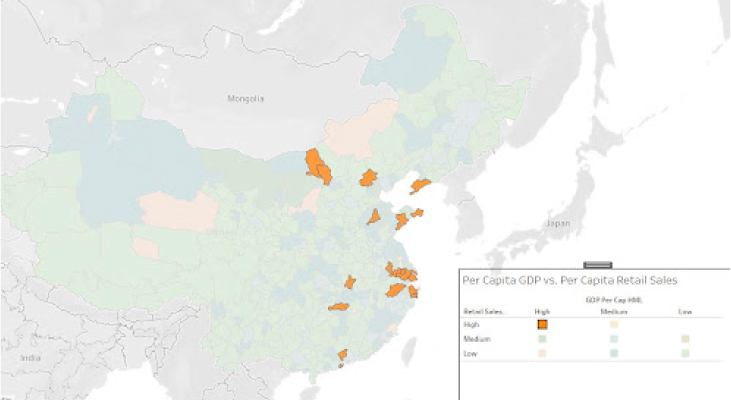
We can then visualize the different aspects of the crosstab and see where there might be opportunities and where there might be saturation. In this scenario we are looking at those prefectures that have both high GDP per Capita and high Retail Sales per Capita.
In this scenario we are looking at those prefectures that have high GDP per Capita but only medium Retail Sales per Capita. This might be an area of opportunity where people have high incomes but limited retail opportunities. This is but one example of cross-tabbing two data points.
Again we can zoom in and look at those prefectures that have high GDP per Capita but only medium Retail Sales per Capita. In this scenario we can see that multiple opportunities may exist, not in Shanghai, but in six surrounding prefectures.


Discover unifying factors
The CRR data platform allows you to select several retail, demographic, economic or wellness data sets and visually see which places stand out over others. We have indexed all of China in our economic development index which allows for finding similar markets that may be attractive to your business, product or services. Once you know the triggers that consumers start purchasing what, you can determine what markets and their sizes your addressable market would be.
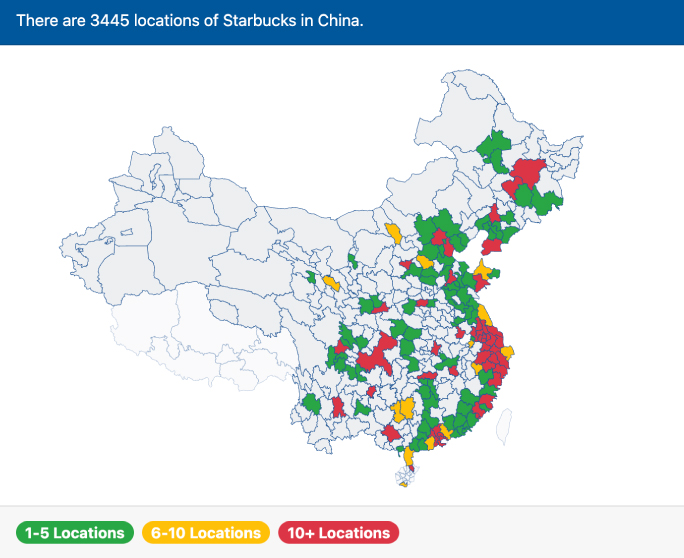
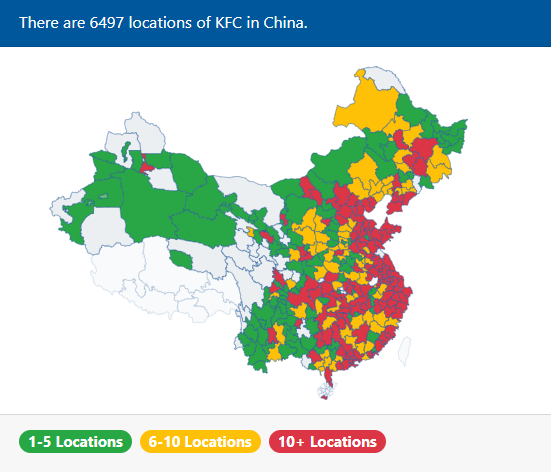
From our list of retail brands and where they are, we show here two different maps: KFC and Starbucks locations throughout China. Once you know where they have gone, you can start exploring why they have chosen certain markets over others. For example, a third of Starbucks’ total China stores in the largest cities throughout China. What districts, counties, and sub-cities have they opened stores in, and determine why. It is interesting to notice that in the places with over USD5,000 in per capita retail sales, there is at least one Starbucks and, in many instances, multiple outlets.
